Nucleus of M81
| Talk Outline |
| Pileup Model |
| Data Preparation |
| Spectral Fitting Software |
| Examples |
| Other Links |
| isis |
| ciao |
| MIT/CXC |
This example concerns an ACIS-S observation (obsid_735) of the
nucleus of M81 by Douglas Swartz. The nucleus appeared as an
extended object about 3 arc-minutes off-axis because it was not the
primary target of the observation.
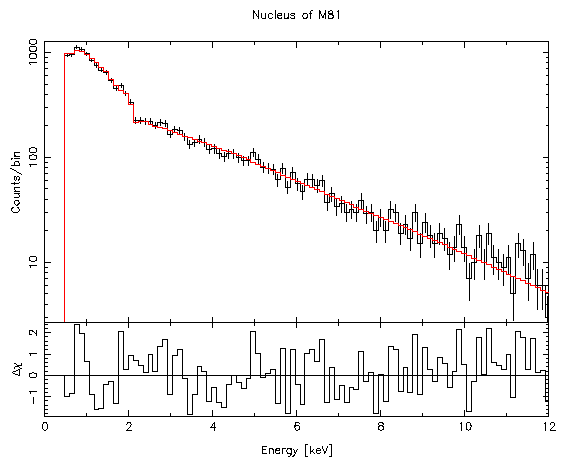
After obtaining the best fit using isis fit_counts
function, the list_par was used to get the fit_parameters:
isis> fit_counts;

 Parameters[Variable] = 7[5]
            Data bins = 99
           Chi-square = 120.8
   Reduced chi-square = 1.285

isis> list_par;

phabs(1)*powerlaw(1)
 idx  param             tie-to  freeze         value          min          max
  1  phabs(1).nH            0     0        0.08063485            0            1
  2  powerlaw(1).norm       0     0       0.006880267            0          0.1
  3  powerlaw(1).PhoIndex   0     0           1.92351            0            3
  4  pileup<1>.nregions     0     1                 3            1           10
  5  pileup<1>.g0           0     1                 1            0            1
  6  pileup<1>.alpha        0     0         0.4810092            0            1
  7  pileup<1>.psffrac      0     0         0.9578905            0            1
As expected, the psffrac parameter falls between 0.9 and 0.95.
The isis rplot_counts function was used to show how well
the model reproduced the data:
print_kernel function shows the degree of pileup:
isis> print_kernel(1);

 1: 0.0241037    0.207965
 2: 0.0652543    0.270813
 3: 0.117772     0.235102
 4: 0.159419     0.153076
 5: 0.172633     0.0797342
 6: 0.155786     0.03461
 7: 0.1205       0.0128769
 8: 0.0815551    0.0041921
 9: 0.0490641    0.0012131
 10: 0.0265656   0.000315941
 11: 0.0130762   7.48036e-05
 12: 0.00590006  1.62349e-05
 13: 0.00245736  1.04828e-05
 *** pileup fraction: 0.792035
This indicates that about 2.4 percent of the frames consisted of single photon events in the pileup regions, 6.5 percent were 2 photon events, etc. However, 21 percent of the observed events were single photon events, 27 percent were due to 2 photons, and so on. This gave a 79 percent pileup fraction.
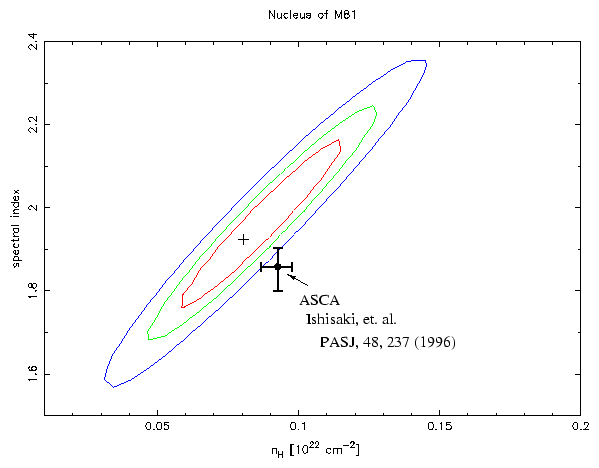
The following figure, produced by isis using its confidence mapping and plotting functions, shows the results of the model compared to the ASCA results of Ishisaki, et. al..
| Previous: Nucleus of M81 | Next: Talk Outline |