Overview of the Pileup Model
| Talk Outline |
| >Pileup Model |
| Data Preparation |
| Spectral Fitting Software |
| Examples |
| Other Links |
| isis |
| ciao |
| MIT/CXC |
The Standard Model
The "standard" model has been used for many years for the analysis of X-ray data. The model is based upon the equation (Davis 2001a)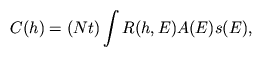
Note that in this model, the N and t occur together as a product. Within the standard model, errors in N or t affect only the normalization of the fitted spectral model s(E) and not its shape. In contrast, within the pileup model, errors in N and t affect both the shape and the normalization of the fitted model s(E).
In the integral equation above, the count rate increases linearly with the incident source flux. This is illustrated in the following figure:
The Pileup Model
The CCD pileup model as implemented in isis is assumed to apply to an extraction region consisting of two subregions: a central region where pileup is assumed to take place, and an outer region assumed to be free of pileup. Furthermore, the pileup region is assumed to be subdivided into n subregions. Let f represent the fraction of flux falling into the pileup region. Then as shown by Davis 2001b, the number of counts expected in the full extraction region is given by![C_(h) & = & (Nt)(1-f)\int dE \;R(h,E) A(E) s(E) \\
& & + Nn
e^{-(t/\bar{g}_0) \int dE\; A(E) fs(E)/n}
\sum_{p=1}^{\infty} \alpha^{p-1}
\int dE \; R(h, E)
\frac{[t A(E)fs(E)/n]^{*p}}{p!},](autopng/pileup_eq2.png)
It is important to note that the number of frames N and the frame time t do not always occur together. This means that unlike the standard model, the total number of detected counts depends not just on the total exposure time Nt, but also on the frame time t and number of frames N separately. For this reason, it is important to specify the exposure time and frame time accurately for the pileup model to work.
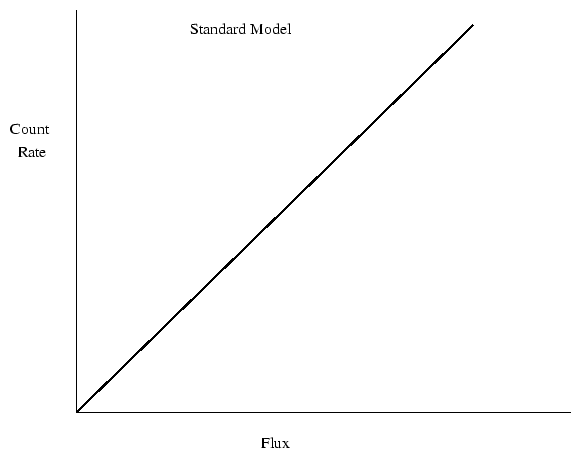
In the pileup model, the predicted count rate is a highly non-linear function of the source flux. An indication of this can be seen from the following figure which shows how the count rate varies with the incident flux in the pileup model:

| Previous: Talk Outline | Next: Data Preparation |