Q0836+7104
| Talk Outline |
| Pileup Model |
| Data Preparation |
| Spectral Fitting Software |
| Examples |
| Other Links |
| isis |
| ciao |
| MIT/CXC |
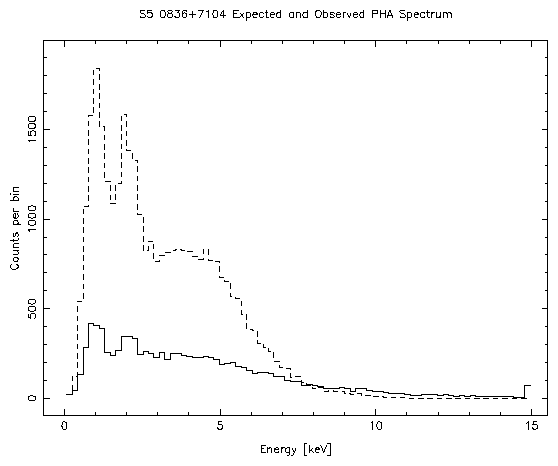
The first example is the Chandra HETG/ACIS-S observations of quasar Q0836+7104. The un-piled first order HETG spectrum was used to gauge the accuracy of the pileup model. As the following figure shows, the first order spectrum also allows one see how pileup has affected the 0th order PHA spectrum:
fit_counts
function, the list_par was used to get the fit_parameters:
isis> fit_counts;

 Parameters[Variable] = 7[5]
 Data bins = 67
 Chi-square = 63.1
 Reduced chi-square = 1.018

isis> list_par;

phabs(1)*powerlaw(1)
 idx  param             tie-to  freeze         value          min          max
  1  phabs(1).nH            0     0        0.03381944            0          0.2
  2  powerlaw(1).norm       0     0       0.002399927            0         0.01
  3  powerlaw(1).PhoIndex   0     0          1.374511            0            3
  4  pileup<1>.nregions     0     1                 1            1           10
  5  pileup<1>.g0           0     1                 1            0            1
  6  pileup<1>.alpha        0     0         0.8728455         0.35            1
  7  pileup<1>.psffrac      0     0         0.9304663          0.9            1
As expected, the psffrac parameter falls between 0.9 and 0.95.
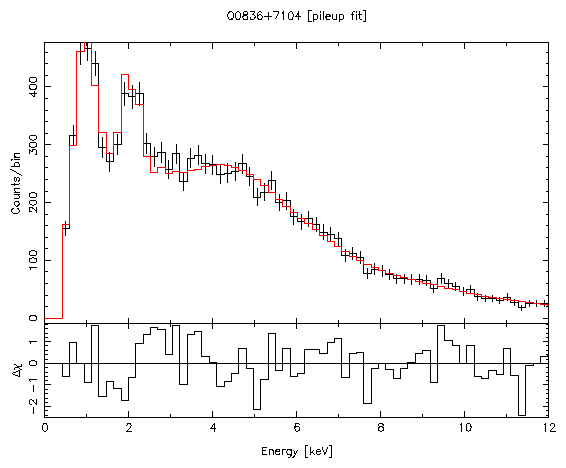
The isis rplot_counts function was used to show how well
the model reproduced the data:
print_kernel function shows the degree of pileup:
isis> print_kernel(1);

 1: 0.367879     0.625742
 2: 0.184252     0.273553
 3: 0.061522     0.0797253
 4: 0.0154067    0.0174266
 5: 0.00308658   0.00304732
 6: 0.000515305  0.000444061
 7: 7.37403e-05  5.54651e-05
 8: 9.23323e-06  6.06186e-06
 *** pileup fraction: 0.374258
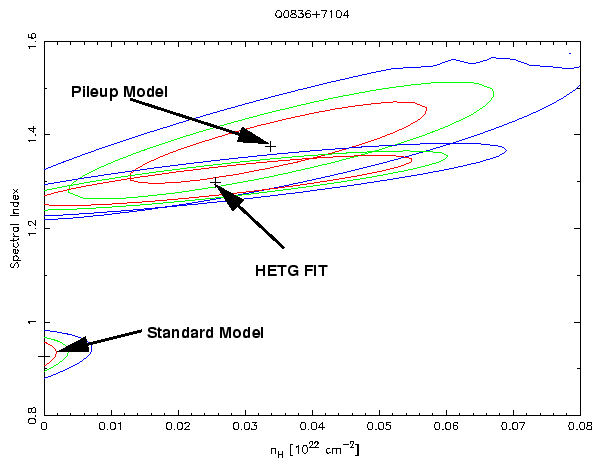
Briefly, this indicates that about 37 percent of the frames consisted of single photon events in the pileup region, 18 percent were 2 photon events, etc. However, 62 percent of the observed events were single photon events, 27 percent were due to 2 photons, and so on. This gave a 37 percent pileup fraction. The following figure, produced by isis using its confidence mapping and plotting functions shows the accuracy of the model when compared with the analysis of the dispersed spectrum. Note that the standard model has completely failed:
| Previous: Examples | Next: NGC 4579 |