volview is an extension module which adds volume visualization capability
to the S-Lang interpreter, using the volpack rendering library and Gtk
widget set (see
http://graphics.stanford.edu/software/volpack/ and
http://www.gtk.org/). Like VWhere (
http://arxiv.org/abs/astro-ph/0412003),
volview is also an example of the notion of a guilet (pronounced
"gooey-let"), by which we
mean to connote visual interfaces of a small-ish, scriptable nature, that
may be easily embedded within -- and launched from -- other programs, even
applications with interactive command lines and no ostensible graphical
interface. For example, volview is frequently used in ISIS (
http://space.mit.edu/cxc/isis/),
our platform for robust, high-performance astrophysical analysis and modeling,
whose main interface is an interactive Matlab(tm)-style command line
prompt. Guilets fill an important software niche, the middle ground
between novice users -- who often argue that visual interfaces make
software easier to use -- and power users -- who frequently complain
that GUIs are more cumbersome and inflexible than command lines.
Experience suggests that the code size and development cycle of the typical
guilet is considerably smaller than that of traditional, monolithic GUIs
(by which we mean to connote applications coded from scratch, typically
in a compiled language such as C or C++, to have only a visual interface).
Moreover, given their scripting
heritage, guilets can be more amenable to changing requirements or ad-hoc
experimentation and customization by the end-user. This is especially
important in the scientific and engineering research arenas.
volview ships with a configure script generated by autoconf, and in most cases
can be built by issuing the following standard commands within a UNIX-like
(e.g. Linux or Cygwin) environment:
        ./configure [options]
        make
        make install
volview has three explicit dependencies: SLIRP, volpack,
and SLgtk.
The latter two of these, if not present on your system, may be automatically
downloaded from our site and installed on your system by using the
--enable-download configure option. Issue a ./configure --help
command for more information.
volview can be loaded at runtime into any suitably configured
application which embeds the S-Lang interpreter, using either
require("volview");
() = evalfile("volview");
Volumes are visualized from arrays, of either 3 or 4 dimensions, none of which may be zero in length. When a 4D array is given the first element is selected as the 3D volume to be visualized (using a 4D array to perform a 3D slideshow will be supported in the near future). For example, this statement sequence
  variable volume = tan([1:8000]);
  reshape(volume,[20,20,20]);
  volview(volume);

slh5 module:
        require("h5");
        volview( h5_read("brain.h5"));

volpack (representing an MRI scan of a human head, derived from
public domain data provided by SoftLab at UNC Chapel Hill).
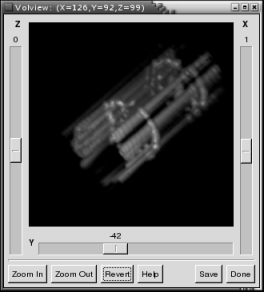
Our final example is drawn from astronomy, and utilizes a spectral cube in the FITS file format, generated by CUBISM ( http://ssc.spitzer.caltech.edu/archanaly/contributed/cubism) from Spitzer observation 3310 of the Cassiopeia A supernova remnant and graciously provided by Dr. Tracey Delaney. The visual is useful because many popular astronomical visualization tools only support visualizing 2D slices of 3D images, which does not reveal interesting structure in the 3rd dimension (e.g. here wavelength). By visualizing the entire volume as a single array
  require("fits");
  volview( fits_read_image("casa_ll2_s12.fits") );