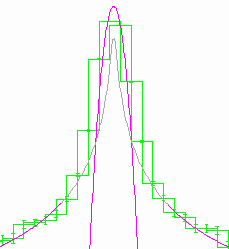
XRCF HEG Mg-K Zeroth-order scan
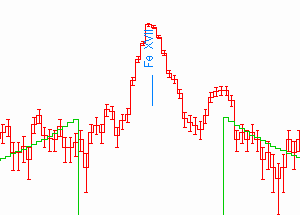
Capella(1318) MEG m=-1 15.01A line
XRCF HEG Mg-K Zeroth-order scan | Capella(1318) MEG m=-1 15.01A line |
Line Response Function
The HETGS line response function, LRF, is the 1-D projection of the dispersed image from a monochromatic source as observed by the HETGS. The LRF core is a mild function of the cross-dispersion (CD) width used in the extraction; further from the core the level of the wings is proportional to the CD width.
Zeroth-Order "LRF"
A starting point to understand the LRF is to understand the 1-D projection of the zeroth-order (undispersed) image. There are, however, differences between zeroth and dispersed orders, for example the HETGS the zeroth-order image is created by all four HRMA shells whereas the MEG and HEG (dispersed) images are created by the combination of shells 1+3 (or 4+6) only. Another slight difference is that the 1-D projections for the MEG and HEG spectra are along their dispersion axes which are at roughly +/- 5 degrees to the mean ACIS-S CHIPX axis.
For the zeroth-order image it is useful to study the projection perpendicular to the ACIS frame-transfer trailed image (a "streak" for a point source) -- that is along the spacecraft Y axis. Because the core of the PSF is heavily piled up, these streak events are essential to extend the dynamic range of ACIS PSF data into the image core. With the streak events properly normalized the full 1-D projection can be measured, e.g., see Measured and modelled zeroth-order 1D projections. The resulting 1-D projection consists of a core region which is reasonably Gaussian-like and extended wings which, as we'll see below, can be approximated by a Lorentzian shape. The FWHM of the Gaussian core is being monitored to search for focus trends in the HETGS performance. e.g., as described in Zeroth-order 1D FWHM vs Time.
Quantifying the Wings
This note defines a quantitative measure for the amplitude of the wing relative to the core which can be applied to both zeroth-order and dispersed data. This value is then determined and compared for various data sets including flight data, XRCF data, and simulations.
Zeroth-order Wing Results
One conclusion from this work is that the full-HRMA zeroth-order wings observed in flight are comparable to the measured levels during XRCF ground testing at Mg-K, 1.254 keV. The XRCF ground testing also shows comparable wing levels for the MEG (1+3) and HEG (4+6) mirror shells. As for simulations, it appears that current MARX simulations (e.g., MARX 3.0 released for NRA-2) produce zeroth-order wing levels that are too small, about 55% of the flight/XRCF values for the case of a Capella-like spectral distribution; this is not too bad.
Dispersed-order Wing Results
XRCF dispersed Mg-K slit-scan data are dominated by the wings of the Mg-K line itself (!) and can be used to set an upper limit on any additional power in the dispersed wings introduced by the HETG gratings at about one half of the XRCF zeroth-order wings level (500 um cross-dispersion width). Flight dispersed data are not useful for wing studies because most bright lines in, for example, Capella and HR1099, are surrounded by other weaker lines and continuum which are well above the XRCF upper limits. The best estimate of LRF wings thus comes from zeroth-order-accurate models folded through the grating response (e.g., MARX or SAOSAC rays traced through the MARX-HETG model) with no additional grating terms added.
The LRF is specified by a function L(X) which gives the "spectral density" in, say, "counts/A" at each wavelength, X. The core of this LRF is often reasonably fit by a Gaussian, let AG be the area of that core-fitting Gaussian, and Xo its centroid.
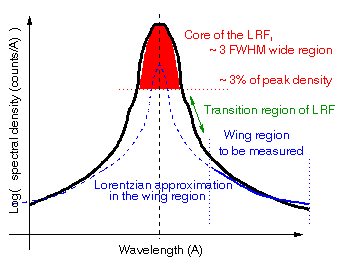
In a region several FWHM from the core the LRF in this region may often be reasonably fit by a Lorentzian. If AL and WL are the area and width of such a Lorentzian then in the wing region we have approximately:
LW(X) ~ ( AL x WL / 2 pi ) / (DX)2
where DX = X - Xo .
Note that only the product of the Lorentzian width and area appears in the above expression - the Lorentzian wing fit has essentially a single degree of freedom (if Xo is fixed from the Gaussian fit.) The relative level of the wings compared to the core can then be quantified by the parameter:
Vw = ( AL x WL ) / ( AG x 2 pi )
which is seen to have units of wavelength but is more illuminatingly described as "fraction per A times A2" as suggested by its use in the following equation:
LW(X) ~ AG x Vw / (DX)2
The value of Vw is used in the sections below to quantify the size of the LRF wing in a region relative to the core area for a variety of data sets; because these values are generally small the values below are given in units of %/A x A2.
Wings at Higher-order - Corollary #1
The wing value defined above behaves in a simple way with diffraction order for the case where the contribution to the LRF is the same for all orders when expressed in "spatial coordinates", e.g., the wings due to a mirror blur. Because the effective dispersion constant, e.g.,in mm/A, is different for the different orders, the wing level value for this spatial contribution, when measured in wavelength space, is reduced to 1/m of the first-order equivalent value [excersize for reader.]
Of course, if the source itself has a wing in its spectrum, in "spectral coordinates", then the measured wing level in wavelength space will be the same in all diffracted orders.
Wing Value for a Lorentzian Line - Corollary #2
If a Lorentzian line shape, with parameters AL and WL, is convolved with a unit-area Gaussian, then the value of AG measured for the resulting line shape will be very close to the Lorentzian area AL. However in the wing region, several Gaussian FWHM's from the core, the convolution will have little effect on the shape. Then the wing level measured will be given by
and the Lorentzian linewidth can be determined from the measured wing value through:Vw = WL / 2 pi
Thus, the (narrow) line width can be measured even though the core is blurred by the (wider) Gaussian response.WL = 2 pi Vw .
XRCF Zeroth-order Measurements
At XRCF the Mg-K 1.254 keV (9.887 A) PSF was scanned in 40um steps by an 80um x 500um (CD width) slit for mirror shell sets 1+3 and 4+6 separately. These scan data were broken into two 80um spaced data sets, offset by 40um from each other. These zeroth-order spatial projections were then translated to the appropriate first-order wavelength scale and simultaneously fit in ISIS for a Gaussian in the core and Lorentzian in the wings. The wing level parameter Vw was then calculated as described above.
XRCF Zeroth-order Mg-K Wing Levels
Grating Order Measured Wing Level *
Vw ( %/A x A2 )Wavelength Scale
at XRCFMEG 0 0.0449 +/- 0.0025 0.455596 A/mm HEG 0 0.0184 +/- 0.0013 0.227810 A/mm * Spatial coordinate translated to wavelength
by appropriate first-order wavelength scale.Note that the HEG m=1 scale is equivalent to the MEG scale with m=2 and so a wing value of 0.045/2 = 0.022 would be expected for the HEG if the HEG mirror shells (4+6) had the same spatial level of scattering as the MEG shells (1+3); apparently this is not too far from the actual case.
Flight and Simulated Data in Zeroth-order
Flight and Simulation data are analyzed with the HAK code and ISIS routines (listed below.) The "cross-dispersion" width used for the zeroth-order is specified by the obs_anal CD_WIDTH parameter which also defines the cross-dispersion width for spectral extraction. A value of 0.5 mm is used to be directly comparable to the XRCF slit-scan data. [Note: the effective cross-dispersion width used to extract the streak events for the flight LRF core is large, of order +/- 512 pixels. However, as simulation shows, the core is concentrated and the additional width does not effect the result.]
Wing level values for the zeroth-order LRF translated to the MEG m=1 wavelength scale are given in the following table for some flight and simulated data sets.
Zeroth-order Flight and MARX Wing Levels
Target Obsid Measured Wing Level *
Vw ( %/A x A2 )Comments Capella 1318 0.0405 +/- 0.0030 Note pileup in core of zeroth order (yellow curve).
(AP processed, 6/5/00)HR 1099 62538 (0.4-2) 0.0455 +/- 0.0015 Event ENERGY limited to 0.4-2.0 keV. Cen X-3 705 0.0863 to 0.0967, 90% conf High-energy source: most events have
ENERGY in 3 to 7 keV range.. . . . . . . . . . . . Capella MARX
Simulation!0.0223 +/- 0.0020 Note agreement of zeroth-order (yellow) and
"streak" (green) in core region (not piledup in simulation.)
Simulation wing level is ~ 55% of reality.* Spatial coordinate translated to The Capella and HR 1099 wing levels agree well with the levels seen at XRCF for the MEG. Cen X-3, a high-energy source, has much larger wing levels, presumably due to mirror scatter at high energies. The MARX simulation of Capella has wing levels that are about 55% of the flight values.
MEG m=1 wavelength scale: 0.01112449 A/pixel
XRCF Dispersed Measurements
At XRCF the Mg-K 1.254 keV (9.887 A) dispersed images were scanned with 80um x 500um (CD width) slits and analyzed as described for the zeroth-order above. Because of the presence of satellite lines on the low-wavelength side of the main line, the wing was only fit on the high-wavelength side. The measured wing level values Vm are tabulated below
XRCF Dispersed Mg-K Wing Levels
Grating Order Measured Wing Level
Vm ( %/A x A2 )Derived
Zeroth-order level
("Instrumental")
Vz/mDerived
Source Level
VsMEG +1 0.1217 +/- 0.0062 0.0648 0.0569 MEG +3 0.0785 +/- 0.0027 0.0648/3
=0.02160.0569 HEG +1 0.0865 +/- 0.0036 0.0310 0.0555 HEG +2 0.0710 +/- 0.0033 0.0310/2=0.0155 0.0555 Assuming that the source has an intrinsic wing level of Vs and an instrumental wing contribution (e.g., from the zeroth-order wing) equivalent of Vz, then we have the relation:
Vm = Vs + Vz/m ,
With two measured values (e.g., MEG m=+1 and +3) we have two equations in two unknowns and the source and instrumental contributions can be determined. These values are given in the "Derived" columns of the table above. The HEG and MEG data sets give a very consistant value for the intrinsic source wing level ~ 0.056 %/A x A2.
Using Corollary #2 above the measured wing value of the Mg-K line, 0.056 +/-0.005(say) %/A x A2, can be used to deduce the natural Lorentzian linewidth of the Mg-K line:
WL = 2 pi x 0.056 x10-2 A = 0.0035 A
The E/dE corresponding to the 0.0035 A width for the 9.887 A line is thus E/dE = 2800 which is consistant with the need for E/dE >= 1800 determined from the HEG LRF core scans. [A value of E/dE=1100 had been assumed at first and was too broad for the measured data; increasing E/dE to 1800 provided agreement.] Hence, the measured source wings are simply due to the natural line width and line shape of the Mg-K line.
The derived instrumental values are somewhat greater than the zeroth-order measurements (0.0648 vs 0.0449 and 0.0310 vs 0.0184) possibly indicating an HETG-added wing term whose value is however less than the mirror contribution. At most then any grating-added wing to the LRF is at the level of ~ 0.020 %/A x A2 at for the MEG and ~ 0.012 %/A x A2 at for the HEG at 9.887 A) and the mirror wings dominate the instrument LRF.
Flight and Simulated Dispersed Data
In analyzing flight and simulated dispersed data here, a cross-dispersion width of 0.5 mm was taken for consistancy with the XRCF measured values. As the tabulated "wing" values and plots for some lines seen in Capella obsid 1318 indicate, flight "wings" are dominated by neighboring lines and continuum with equivalent values in the range 0.2 to 2.0 compared to the underlying instrument wing values of ~ 0.04 and 0.02 for MEG and HEG. It is thus unlikely that flight dispersed data will add information about the underlying wings of the LRF.
"Wing" Levels for Lines in Capella Obsid 1318
Line
wavelength
(A)MEG m=-1
(%/A x A2)HEG m=-1
(%/A x A2)6.6477 2.07 0.43 8.419 2.07 0.36 9.1685 2.19 0.86 12.132 0.94 0.18 15.013 1.04 0.34 18.967 0.28 - Note, additionally, that nominal CXC processing creates PHA spectra by selecting events that are +/-6.6E-4 degrees from the nominal dispersion axis, that is +/- 0.1 mm or a 0.2 mm total width. Thus instrumental wing levels given in this note (e.g., the expected flight MEG m=1 wing level of order 0.04 %/A x A2) will appear reduced by the factor 0.4 in CXC standard PHA files.
Please send any comments to Dan Dewey at dd@space.mit.edu.
MIT Accessibility