
Tests of new geom files:
telD1999-07-23geomN0004A.fits for HETG/ACIS-S, which as Rowland
spacing of 8632.480mm and pixel size of 0.0239870 mm.
telD1999-07-23geomN0004B.fits (for LETG/HRC-S): Rowland spacing of 8637.0.
Tests were run to check new geom files and compare output to prior processing. Tools were run by setting the instruments field of geom.par to CALDB for current files, or to one of the above files. Processing was run from evt1 to pha2 (*_detect_events, tgdetect, tg_create_mask, tg_resolve_events, tgextract) for each geom file.
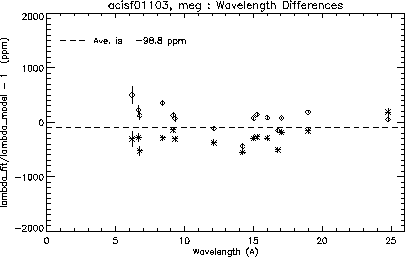
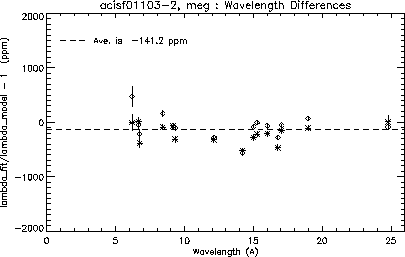
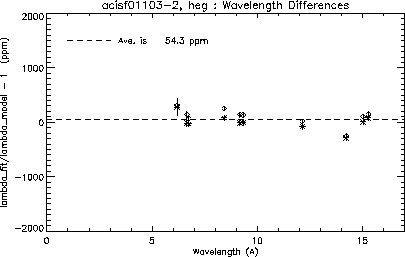
Plots are for the two pha files and heg/meg and show the measured plus and minus order wavelength deviations from the expected "theory" values. A horizontal dashed line gives the average deviation of all points (hence averaging plus and minus as well as different wavelengths).
This average has changed a little:
			     MEG        HEG
	  acisf01103       -98.8       79.9   (old geom file)
	  acisf01103-2    -141.2       54.3   (new geom file)
... changed by 30-40 ppm which is close to the ~20ppm expected (See this Technical Note for calibration details.)
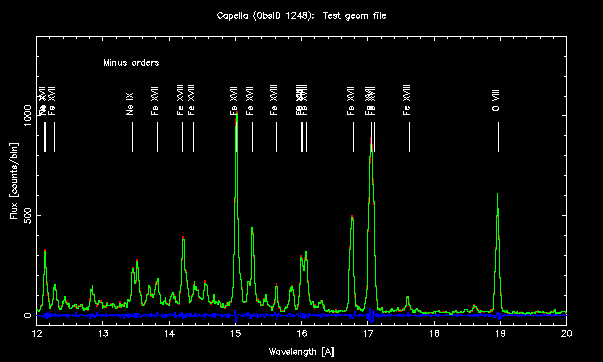
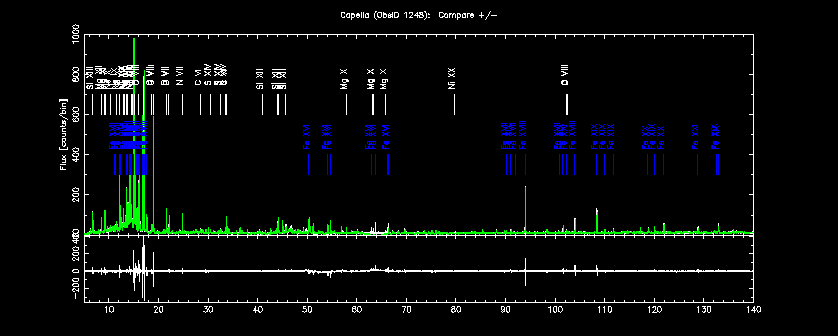
The run of ObsID 1248 (Capella, LETG/HRC-S) produced nearly identical results to the prior geom file, as it should. The figure above shows the residuals between spectra extracted with the old and new geom files; more bandwidth is given in this postscript file. (Red is old, green is new, the residuals are new-old, in blue.) Line labels are the brightest lines in a LogT=6.8 model from APED.
The minus side spectrum is the white line (black in postscript), and the plus is green. Residuals in the sense of minus-plus are shown in the lower panel. Plus and minus orders to not agree, nor does one necessarily agree with the true wavelength scale. The wavelength scale error is currently being pursued by calibration. (Line labels are not identifications, but are the brightest lines in the region for a LogT=6.8 APED model.)
CIAO shell commands to process events are
Proc_hetgs.sh, and
Proc_letgs.sh
ISIS commands to make figures are here.