OSIP: Order-Sorting, and Integrated Probability
Grating/ACIS-S order-sorting is done by comparing CCD photon ENERGY
values to limits stored in a table. These clipping limits
are determined from the CCD resolution and gain, which are both
dependent upon CCD pixel, especially CHIPY on the Front-Illuminated
(FI) devices. The OSIP tables, used by
tg_resolve_events, are constructed for an a priori
specified width about the center of the main peak. The
widths are typically 2.5 to 4 * sigma (where sigma is the
Gaussian dispersion of the main peak's functional
parameterization). For the outer CCDs of the ACIS-S array (S0
and S5), it is necessary to reduce the width so that order regions do
not overlap. For others, it was increased to accomodate inaccuracies
in the CCD gain/CTI calibration.
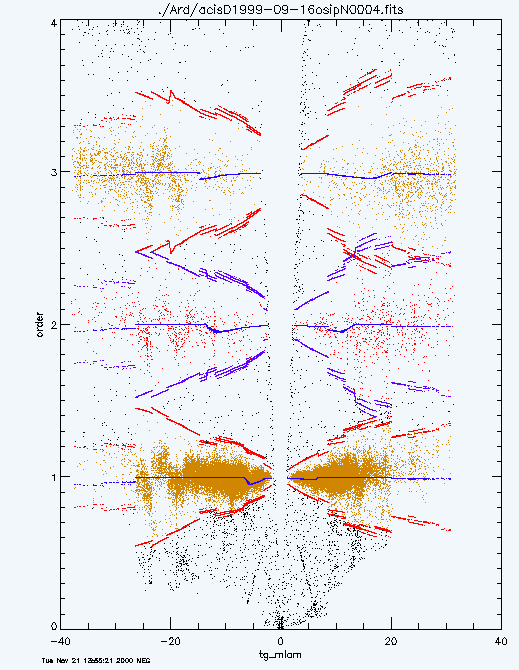
Here are graphical examples of the order-regions. The
horizontal axes are the grating m*lambda (tg_mlam; m is
the diffraction order and lambda the wavelength in Angstroms)
from the Level 1.5 events file. The vertical axis is the ratio
of the grating wavelength (m*lambda) to the CCD
"wavelength" (proportional to hc/ENERGY), and is a real-valued
estimate of the diffraction order.
The position of each photon is used to look-up the limits in the OSIP
table. These are plotted for each photon and form the envelope about
the events. In addition, the integrated probability between
those limits is plotted, but offset in y by order-1
(this is used by mkgarf in computing the effective area).
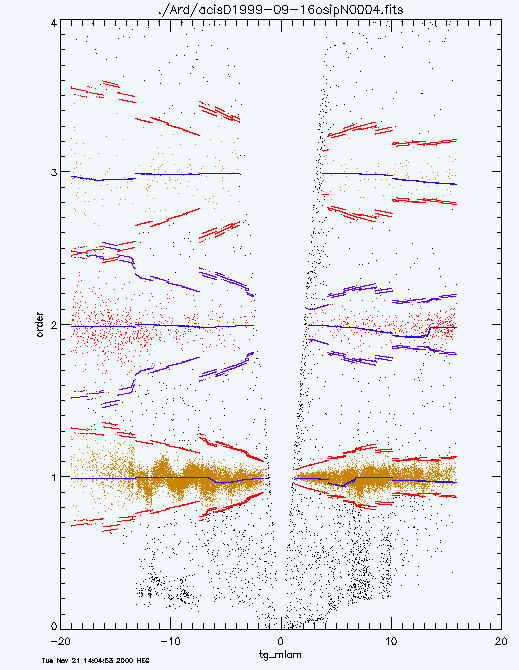
Features to note:
-
Events within the boundary are assigned to the nearest integral order
-
The MEG and HEG boundaries get very wide on the side where the order
is imaged at high CHIPY where CTI degradation has made the CCD
resolution worse. For high orders where the boundaries cross, the
energy ratio is rounded to an integral order.
-
The escape peak affect is visible in the integrated probablility (central
line through each order) as a glitch at about 6 A;
-
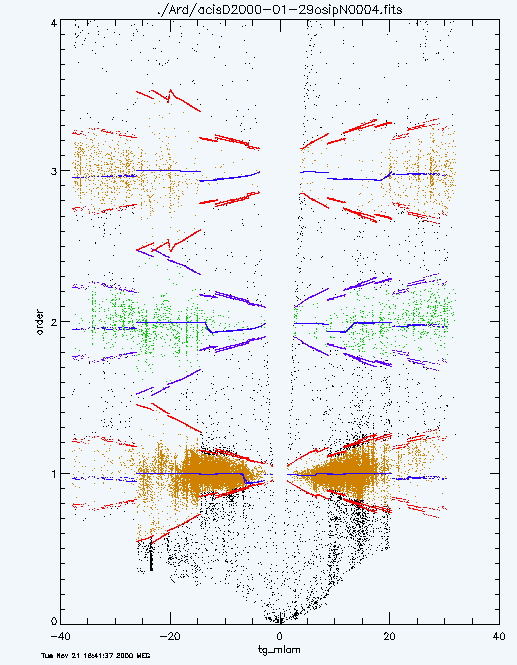
The integrated probability drops on S0 and S5 because of the discontinuous
change to 2.5*sigma limits
-
Bifurcation is present in the order boundary (the OSIP limits have doubled
values at the same x); this is due to the strong gradient in CCD
resolution with CHIPY, and the dither images photons at different CHIPY
for the same x.
-
In the observed data, there are still residual gain errors which shift
the distribution away from the expected center and causes some clipping
(e.g., -120 HEG at tg_mlam=-17A).
UPDATE: OSIP tables revised, 2000.11.21
-
Due to poor gain-correction on ACIS-S1, we need to broaden the OSIP
region in order to not clip the spectrum. (This should be mitigated
eventually by an improved gain-map).
- We have found that the variance of the FWHM in the S1 FEF file is
unrealistic. We have replaced the chip-x,y variations with the chip
mean value at each energy, for the BI chips (CCD_ID 5 and 7; ACIS-S1
and S3).
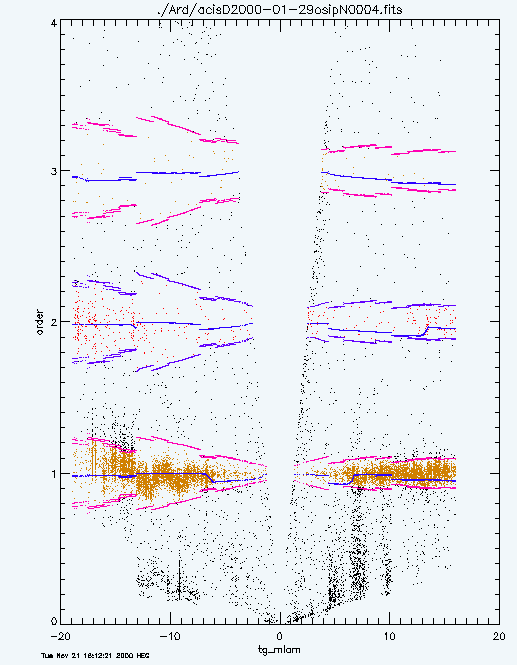
- The -120 FWHM limits were too strict. They reflect an improved
resolution with lower temperature, but the test observation (Capella,
ObsID 57) was somewhat clipped. We have expanded the limits to 4.0
sigma (where sigma is the dispersion of the local CCD response).
Observation, -110 C, MEG (HR 1099, ObsID 1252)
Observation, -110 C, HEG (HR 1099, ObsID 1253)
Observation, -120 C, MEG (Capella, ObsID 57)
Observation, -120 C, HEG (Capella, ObsID 57)
The OSIP files are:
Temp
Filename Template
-90 acisD1999-07-22osipN0004.fits
-100 acisD1999-08-13osipN0004.fits
-110 acisD1999-09-16osipN0004.fits
-120 acisD2000-01-29osipN0004.fits
IDL code which made the figures above is here.
2000.11.21 David Huenemoerder & Glenn Allen.
Previous tables (2000.08.23)
Simulation, -110 C, MEG
Simulation, -110 C, HEG
Observation, -110 C, MEG (Capella, ObsID 1318)
Observation, -110 C, HEG (Capella, ObsID 1318)
The OSIP files are:
Temp
Filename Template
-90 acisD1999-07-22osipN0003.fits
-100 acisD1999-08-13osipN0003.fits
-110 acisD1999-09-16osipN0003.fits
-120 acisD2000-01-29osipN0003.fits
IDL code which made the figures above is here.
2000.08.23 d.p.huenemoerder
dph@space.mit.edu