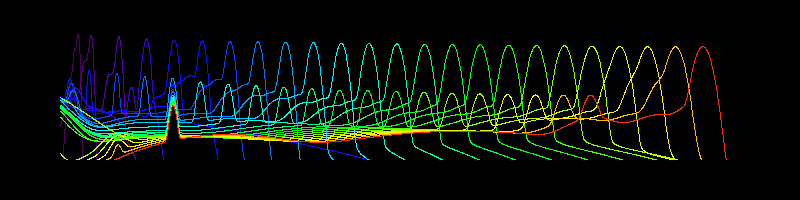
These are animated GIFs of the ACIS response, made from FEF files.
They are for two FEF regions, near and far from the readout, and
they show the PHA redistribution (each frame in probability vs PHA) vs
energy (frame). Energy is the 1st counter in the upper left, and
the second counter is the fractional area within +-3*sigma of the main
peak.
GIF file
FEF
S0_00_00_rmf.gif acis4a_x00_y00_FP-110_D1999-09-16fef_phaN0002.fits.gz
S0_00_31_rmf.gif acis4a_x00_y31_FP-110_D1999-09-16fef_phaN0002.fits.gz
S1_00_00_rmf.gif acis5a_x00_y00_FP-110_D1999-09-16fef_phaN0002.fits.gz
S1_00_15_rmf.gif acis5a_x00_y15_FP-110_D1999-09-16fef_phaN0002.fits.gz
The first two are a Front-Illuminated chip, near the readout (00_00) and far from it (00_31). The next two are for a Back-Illuminated chip.
These should play with your browser configured for in-line gifs, or with xanim.
IDL source code is here.
2000.08.17 d.p.huenemoerder dph@space.mit.edu